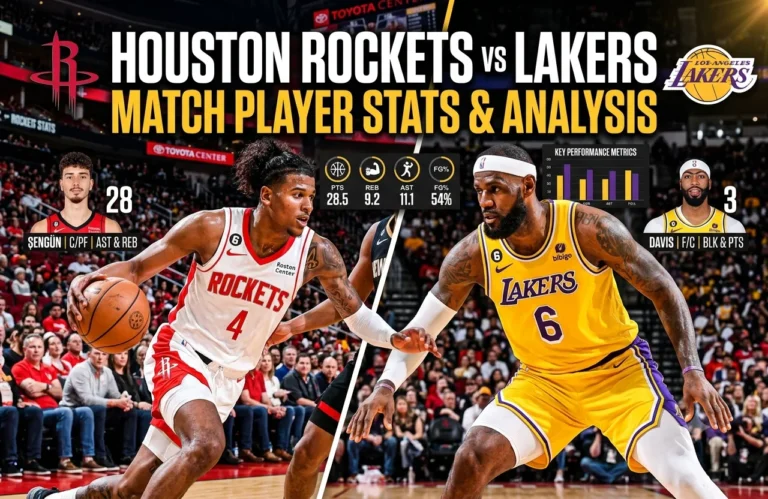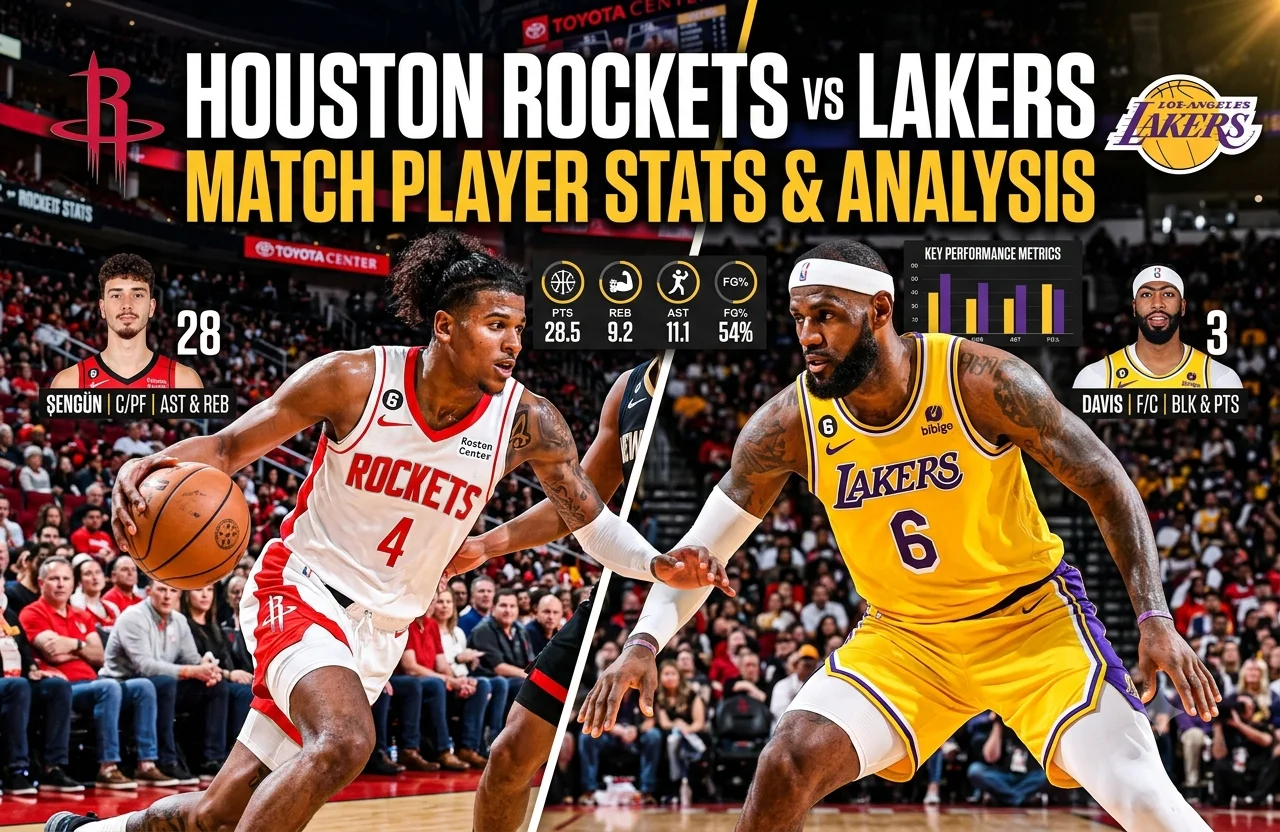
The Houston Rockets vs Lakers match player stats from April 24, 2026, highlight one of the most dramatic games of the Western Conference first-round playoff series. The Los Angeles Lakers defeated the Houston Rockets 112-108 in overtime at Toyota Center, moving ahead 3-0 in the series.
The final score, however, does not fully explain how competitive the game was.
Houston appeared to have control late in regulation before Los Angeles mounted a comeback and forced overtime. Alperen Sengun delivered a dominant performance for the Rockets with 33 points and 16 rebounds, while LeBron James led the Lakers with 29 points and 13 rebounds. Marcus Smart also played a major role, finishing with 21 points, 10 assists and five steals.
The official NBA box score contains the complete statistical record for the game.
The numbers show an interesting contrast between the two teams. Houston made more field goals and collected more rebounds, while Los Angeles was considerably more efficient from the field and from three-point range. The Lakers also made seven more free throws and finished with seven more assists.
Those differences became especially important because the game was decided by only four points after five minutes of overtime.
Table of Contents
- Houston Rockets vs Lakers Match Player Stats: Game Overview
- Final Score and Quarter-by-Quarter Breakdown
- Team Shooting Comparison
- LeBron James’ Complete Performance
- Rui Hachimura’s Efficient Scoring
- Marcus Smart’s All-Around Contribution
- Luke Kennard’s Role in the Lakers Offense
- Deandre Ayton’s Defensive and Rebounding Value
- Lakers Bench Contributions
- Alperen Sengun’s Dominant Performance
- Amen Thompson’s Two-Way Impact
- Jabari Smith Jr. and His Three-Point Shooting
- Reed Sheppard’s High-Volume Performance
- Tari Eason’s Defensive Contribution
- Why Houston’s Rebounding Advantage Was Not Enough
- Three-Point Shooting Difference
- Free-Throw Advantage
- Shooting Efficiency and Advanced Numbers
- Turnovers and Possession Value
- Assists and Offensive Balance
- Houston’s Second-Half Comeback
- What Happened in the Final Seconds
- Overtime Breakdown
- What the Player Statistics Show
- Biggest Individual Performances
- Full Lakers Player Statistical Breakdown
- Full Rockets Player Statistical Breakdown
- Most Important Statistical Takeaways
- How to Read the Box Score
- Why the Four-Point Margin Matters
- Frequently Asked Questions
- Conclusion
Houston Rockets vs Lakers Match Player Stats: Game Overview
Los Angeles entered the matchup with a 2-0 advantage in the first-round series. By the end of the night, the Lakers had extended that advantage to 3-0.
The game finished 112-108 after overtime, with the two teams tied 101-101 at the end of regulation.
The contest took place at Toyota Center in Houston and required an additional five-minute period to determine the winner.
Los Angeles scored 11 points in overtime, while Houston managed seven.
Final Score and Quarter-by-Quarter Breakdown
| Team | Q1 | Q2 | Q3 | Q4 | OT | Final |
|---|---|---|---|---|---|---|
| Los Angeles Lakers | 39 | 24 | 17 | 21 | 11 | 112 |
| Houston Rockets | 32 | 20 | 23 | 26 | 7 | 108 |
The Lakers started strongly and held a 63-52 advantage at halftime. Houston then changed the momentum after the break.
The Rockets scored 23 points in the third quarter and 26 in the fourth, while Los Angeles managed 17 and 21 respectively.
Houston therefore outscored Los Angeles 49-38 during the second half.
That comeback eventually put the Rockets in position to win, but the Lakers produced the critical plays needed to send the game into overtime.
Team Shooting Comparison
The team statistics provide an immediate explanation for the result.
| Statistic | Lakers | Rockets |
|---|---|---|
| Field Goals | 38/79 | 40/98 |
| Field Goal Percentage | 48.1% | 40.8% |
| Three-Pointers | 12/29 | 11/39 |
| Three-Point Percentage | 41.4% | 28.2% |
| Free Throws | 24/32 | 17/23 |
| Free Throw Percentage | 75.0% | 73.9% |
| Rebounds | 45 | 49 |
| Assists | 28 | 21 |
| Steals | 12 | 15 |
| Blocks | 6 | 6 |
| Turnovers | 20 | 15 |
Houston made 40 field goals compared with 38 by Los Angeles. However, the Rockets required 98 attempts to reach that number, while the Lakers needed only 79 attempts.
That difference is important.
Los Angeles converted 48.1% of its field-goal attempts, while Houston shot 40.8%.
The three-point numbers show an even larger gap. The Lakers made 12 of 29 attempts for 41.4%, while Houston made 11 of 39 for 28.2%.
Free throws also favored Los Angeles. The Lakers made 24, seven more than Houston’s 17.
Therefore, although Houston won the rebounding battle and protected the ball better, Los Angeles generated more points from its shooting opportunities.
LeBron James’ Complete Performance
LeBron James finished the game with:
- 29 points
- 13 rebounds
- 6 assists
- 3 steals
- 1 block
- 10-for-22 shooting
- 4-for-9 from three-point range
- 5-for-6 at the free-throw line
- 45:04 minutes
James was involved in nearly every important part of the Lakers’ performance.
His 29 points made him Los Angeles’ leading scorer, but his 13 rebounds and six assists were equally important. He also contributed three steals and a block.
There was one major negative in his statistical line: James committed eight turnovers.
Even with that issue, his overall contribution remained substantial because he combined scoring, rebounding, passing and defense.
His biggest moment arrived late in regulation.
With Houston holding the advantage, James stole the ball from Reed Sheppard and later connected on the tying three-pointer with 13 seconds remaining. That basket brought the game level at 101-101 and gave Los Angeles an opportunity to win in overtime.
The sequence demonstrates why a full box-score analysis needs to consider the timing of a player’s contributions rather than looking only at the final scoring total.
Rui Hachimura’s Efficient Scoring
Rui Hachimura gave Los Angeles highly efficient offensive production.
He finished with 22 points while shooting 8-for-14 from the field and 4-for-7 from three-point range.
His numbers included:
- 22 points
- 4 rebounds
- 2 assists
- 8/14 field goals
- 4/7 three-pointers
- 2/4 free throws
Hachimura converted 57.1% of his field-goal attempts and 57.1% of his three-point attempts.
His four made three-pointers were particularly useful because they prevented Houston from concentrating exclusively on James and the Lakers’ interior players.
Instead of needing a large number of shots to reach 22 points, Hachimura produced his scoring efficiently.
In a close playoff game, that type of secondary scoring can make a significant difference.
Marcus Smart’s All-Around Contribution
Marcus Smart produced one of the most complete statistical performances for Los Angeles.
He recorded:
- 21 points
- 10 assists
- 5 steals
- 2 blocks
- 4 rebounds
- 5/9 field goals
- 2/4 three-pointers
- 9/11 free throws
Smart’s 10 assists were a team high, while his five steals also led the Lakers.
His performance became even more important during overtime, when he scored eight points.
The value of his performance extended beyond scoring. His passing helped organize the Lakers’ offense, while his defensive activity created additional opportunities.
His five steals were particularly valuable because each steal ended a Houston possession and potentially created a transition opportunity for Los Angeles.
Smart also finished with 10 assists against three turnovers, giving the Lakers reliable ball-handling and playmaking.
Luke Kennard’s Role in the Lakers Offense
Luke Kennard played 45:22 and scored 14 points.
His shooting numbers were:
- 4/12 from the field
- 1/6 from three-point range
- 5/6 from the free-throw line
He also recorded six rebounds and six assists.
Although his shooting percentages were not particularly strong, Kennard still contributed to the overall offensive structure.
His six assists were especially useful. He was not simply waiting around the perimeter for catch-and-shoot opportunities. He also helped move the ball and create chances for teammates.
His ability to space the floor forced Houston’s defense to account for another perimeter option while dealing with James, Hachimura and Smart.
Deandre Ayton’s Defensive and Rebounding Value
Deandre Ayton finished with only two points, going 1-for-3 from the field.
However, the scoring total does not tell the entire story.
Ayton also contributed:
- 6 rebounds
- 2 assists
- 1 steal
- 1 block
His limited scoring did not mean he had no role in the game.
Ayton provided an interior presence against Houston’s frontcourt, particularly while dealing with Alperen Sengun and Houston’s other rebounders.
This is a useful reminder when examining playoff statistics: centers can affect a game through screens, rebounds, positioning and defense even when their scoring numbers are low.
Lakers Bench Contributions
Los Angeles also received useful production from its bench.
Jaxson Hayes scored 12 points on 5-for-8 shooting and added four rebounds, one steal and two blocks.
Bronny James finished with five points in just over nine minutes. He shot 2-for-2 from the field and 1-for-1 from three-point range, while also recording one rebound and one block.
Jarred Vanderbilt added five points and six rebounds.
Jake LaRavia scored three points, while Adou Thiero played only briefly.
The Lakers did not rely on one reserve for a huge scoring performance. Instead, several players provided smaller contributions that helped support the team’s main rotation.
Hayes was particularly efficient, scoring 12 points on only eight field-goal attempts.
Alperen Sengun’s Dominant Performance
Alperen Sengun delivered Houston’s biggest individual scoring performance.
He finished with:
- 33 points
- 16 rebounds
- 6 assists
- 3 steals
- 1 block
- 15/27 field goals
His 16 rebounds were the highest total by any player in the game.
Sengun also combined scoring with playmaking. His six assists showed that Houston could use him as more than an interior scorer.
He could receive the ball in the post, attack mismatches or facilitate for teammates.
His individual numbers were excellent, but Houston ultimately could not turn that production into a victory.
That illustrates an important point about basketball statistics: an outstanding individual performance does not automatically determine the team result.
Amen Thompson’s Two-Way Impact
Amen Thompson also produced an impressive all-around line.
He recorded:
- 26 points
- 11 rebounds
- 4 assists
- 3 steals
- 3 blocks
- 8/14 field goals
- 10/13 free throws
Thompson’s ability to score while contributing on defense made him one of Houston’s most active players.
His 10-for-13 free-throw shooting showed that he was able to create opportunities at the line and convert them.
His 11 rebounds also helped Houston finish with a team rebounding advantage.
Three steals and three blocks further demonstrate how much defensive activity he provided.
Jabari Smith Jr. and His Three-Point Shooting
Jabari Smith Jr. scored 24 points while shooting 8-for-16 from the field.
His biggest contribution came from outside.
Smith made six of his 10 three-point attempts, giving Houston 18 points from three-point shots by himself.
A 6-for-10 performance from beyond the arc is significant, particularly because Houston as a team shot only 28.2% from three.
Smith’s shooting created additional space for Sengun and Thompson to operate.
The Lakers had to respect him on the perimeter, which made it harder to concentrate entirely on Houston’s interior attack.
Reed Sheppard’s High-Volume Performance
Reed Sheppard finished with 17 points, seven assists, four rebounds, three steals and two blocks.
He provided several useful contributions, but his shooting efficiency was a concern.
Sheppard went:
- 6/21 from the field
- 4/13 from three-point range
- 1/2 from the free-throw line
He therefore needed 21 field-goal attempts to score 17 points.
His seven assists helped offset some of that inefficiency, while his three steals and two blocks showed defensive involvement.
Houston’s overall 40.8% field-goal shooting made efficient perimeter scoring especially important.
Tari Eason’s Defensive Contribution
Tari Eason scored five points but produced four steals.
He also collected four rebounds and two assists.
His offensive contribution was limited, but his defensive activity stood out.
Four steals can significantly affect the flow of a playoff game because they can interrupt an opponent’s offensive possessions and create transition chances.
Eason’s performance is another example of why scoring alone does not capture a player’s entire contribution.
Why Houston’s Rebounding Advantage Was Not Enough
Houston finished with 49 rebounds compared with 45 for Los Angeles.
The Rockets therefore won the rebounding battle by four.
However, that advantage did not translate into enough additional scoring.
The Lakers were much more efficient when they took shots.
Los Angeles shot 48.1% from the field.
Houston shot 40.8%.
That represents a 7.3-percentage-point difference.
The three-point numbers were even more revealing:
- Lakers: 41.4%
- Rockets: 28.2%
Houston attempted 39 three-pointers but made only 11.
Los Angeles attempted only 29 and made 12.
The Lakers therefore made one more three-pointer while taking 10 fewer attempts.
That efficiency difference helped offset Houston’s advantages in rebounds and turnovers.
Three-Point Shooting Difference
The Lakers scored 36 points from three-point shots.
Houston scored 33.
The scoring difference from three-point baskets was only three points, but the efficiency behind those totals was dramatically different.
Los Angeles made 12 of 29 attempts.
Houston made 11 of 39.
In other words, Houston took 10 more three-point attempts to make one fewer shot.
That matters greatly in a four-point overtime game.
Houston’s 28.2% three-point shooting meant that the Rockets needed strong production from the interior to compensate.
Sengun and Thompson delivered that production, but the perimeter shooting was not consistent enough to provide the same level of support.
Free-Throw Advantage
Free throws also favored Los Angeles.
The Lakers finished 24-for-32 at the line.
Houston went 17-for-23.
Los Angeles therefore made seven more free throws.
The free-throw percentages were relatively close:
- Lakers: 75.0%
- Rockets: 73.9%
The primary difference was opportunity rather than accuracy.
The Lakers earned more chances and converted enough of them to create a meaningful scoring advantage.
In a close playoff game, those extra points can become extremely important, particularly during late-game possessions.
Shooting Efficiency and Advanced Numbers
Raw field-goal totals do not completely explain the difference between the teams.
Houston made 40 field goals.
Los Angeles made 38.
Yet the Lakers scored more points.
One useful measurement is effective field-goal percentage, which gives additional value to made three-pointers.
Based on the supplied statistics:
- Lakers effective field-goal percentage: approximately 55.7%
- Rockets effective field-goal percentage: approximately 46.4%
That is a difference of roughly 9.3 percentage points.
Estimated true shooting percentage also favors Los Angeles:
- Lakers: approximately 60.2%
- Rockets: approximately 49.9%
These figures reinforce the same conclusion shown by the basic shooting statistics: Los Angeles converted its scoring opportunities more efficiently.
Turnovers and Possession Value
Houston committed 15 turnovers.
Los Angeles committed 20.
Normally, a five-turnover advantage would be expected to help the team with fewer giveaways.
But the Rockets still lost.
The reason is that turnover numbers must be considered alongside shooting efficiency and scoring production.
LeBron James accounted for eight Lakers turnovers, which was a significant number. However, he also contributed 29 points, 13 rebounds and six assists.
Marcus Smart recorded 10 assists and three turnovers.
Luke Kennard had six assists and three turnovers.
Los Angeles therefore had some ball-security problems, but its stronger shooting and free-throw production compensated for those extra turnovers.
Assists and Offensive Balance
The Lakers recorded 28 assists.
Houston finished with 21.
That seven-assist difference suggests that Los Angeles received more shared offensive creation.
Smart led the Lakers with 10 assists.
James and Kennard each added six.
Together, those three players accounted for 22 assists.
Houston also had important playmakers. Sheppard recorded seven assists, while Sengun had six.
However, the Lakers distributed their assists among multiple players and produced more total assists.
That balance helped the Lakers maintain offensive movement even when Houston’s defense increased its pressure.
Houston’s Second-Half Comeback
The game changed dramatically after halftime.
Houston scored:
- 23 points in the third quarter
- 26 points in the fourth quarter
Los Angeles scored:
- 17 points in the third quarter
- 21 points in the fourth quarter
The Rockets therefore outscored the Lakers by 11 points across the second half.
The comeback was not based on a single short scoring burst. Houston consistently improved its offensive production after halftime.
The Rockets eventually moved into a position where they could close out the game.
However, the final possessions of regulation changed the outcome.
What Happened in the Final Seconds
Late-game possessions became the defining part of the contest.
Houston held a six-point advantage with less than 30 seconds remaining but could not preserve the lead.
Marcus Smart was fouled on a three-point attempt with 25 seconds remaining following a Houston turnover. He made all three free throws.
The gap narrowed.
Then James stole the ball from Reed Sheppard and hit the tying three-pointer with 13 seconds remaining.
The game finished regulation tied at 101.
Two possessions had completely changed the direction of the game.
Houston had controlled much of the fourth quarter, but Los Angeles executed better during the closing sequence.
Overtime Breakdown
Los Angeles carried its momentum into the extra period.
The Lakers scored 11 overtime points.
Houston scored seven.
Marcus Smart became especially important, scoring eight of Los Angeles’ overtime points.
The Lakers also continued producing defensive plays, including a steal by James.
Houston was unable to generate enough consistent offense to match Los Angeles during the five-minute period.
The Lakers ultimately closed out the 112-108 victory.
What the Player Statistics Show
The Houston Rockets vs Lakers match player stats show that neither team dominated every statistical category.
Houston had several advantages:
- 49 rebounds to 45
- 15 turnovers compared with 20
- 40 made field goals compared with 38
- Major individual performances from Sengun and Thompson
Los Angeles, however, had important advantages in scoring efficiency:
- 48.1% field-goal shooting
- 41.4% three-point shooting
- 24 made free throws
- 28 assists
- 11 overtime points
Houston’s corresponding numbers were:
- 40.8% field-goal shooting
- 28.2% three-point shooting
- 17 made free throws
- 21 assists
- 7 overtime points
The comparison shows that winning a basketball game does not require leading every statistical category.
The Lakers were able to overcome their turnover disadvantage and Houston’s rebounding advantage because they converted their scoring opportunities more effectively.
Biggest Individual Performances
LeBron James
29 points, 13 rebounds, 6 assists, 3 steals and 1 block
James provided the Lakers with scoring, rebounding, passing and defense. His tying three-pointer late in regulation was one of the game’s defining plays.
Alperen Sengun
33 points, 16 rebounds, 6 assists, 3 steals and 1 block
Sengun led Houston in scoring and rebounding and produced the highest individual scoring total of the game.
Amen Thompson
26 points, 11 rebounds, 4 assists, 3 steals and 3 blocks
Thompson delivered a balanced performance on both ends of the court.
Jabari Smith Jr.
24 points, 6 rebounds and 6 made three-pointers
Smith’s perimeter shooting provided Houston with a major offensive weapon.
Marcus Smart
21 points, 10 assists, 5 steals and 2 blocks
Smart combined playmaking, defense and scoring, then added eight points in overtime.
Rui Hachimura
22 points on 8-for-14 shooting with four made three-pointers
Hachimura supplied efficient secondary scoring and important perimeter spacing.
Full Lakers Player Statistical Breakdown
| Player | MIN | FG | 3PT | FT | REB | AST | STL | BLK | TO | PTS |
|---|---|---|---|---|---|---|---|---|---|---|
| LeBron James | 45:04 | 10/22 | 4/9 | 5/6 | 13 | 6 | 3 | 1 | 8 | 29 |
| Rui Hachimura | 43:48 | 8/14 | 4/7 | 2/4 | 4 | 2 | 1 | 0 | 1 | 22 |
| Deandre Ayton | 32:46 | 1/3 | 0/0 | 2/3 | 6 | 2 | 1 | 1 | 3 | 2 |
| Marcus Smart | 39:17 | 5/9 | 2/4 | 9/11 | 4 | 10 | 5 | 2 | 3 | 21 |
| Luke Kennard | 45:22 | 4/12 | 1/6 | 5/6 | 6 | 6 | 0 | 0 | 3 | 14 |
| Jake LaRavia | 14:55 | 1/4 | 0/0 | 0/0 | 2 | 1 | 1 | 0 | 0 | 3 |
| Jaxson Hayes | 19:57 | 5/8 | 0/0 | 2/3 | 4 | 0 | 1 | 2 | 1 | 12 |
| Bronny James | 9:12 | 2/2 | 1/1 | 0/0 | 1 | 0 | 0 | 1 | 0 | 5 |
| Jarred Vanderbilt | 14:38 | 2/5 | 0/0 | 1/2 | 6 | 1 | 0 | 0 | 0 | 5 |
| Adou Thiero | 0:01 | 0/0 | 0/0 | 0/0 | 0 | 0 | 0 | 0 | 0 | 0 |
Full Rockets Player Statistical Breakdown
| Player | MIN | FG | 3PT | FT | REB | AST | STL | BLK | TO | PTS |
|---|---|---|---|---|---|---|---|---|---|---|
| Tari Eason | 45:38 | 2/9 | 0/0 | 1/1 | 4 | 2 | 4 | 0 | 1 | 5 |
| Jabari Smith Jr. | 43:43 | 8/16 | 6/10 | 2/2 | 6 | 1 | 1 | 0 | 2 | 24 |
| Alperen Sengun | 46:51 | 15/27 | 1/5 | 2/3 | 16 | 6 | 3 | 1 | 3 | 33 |
| Reed Sheppard | 45:45 | 6/21 | 4/13 | 1/2 | 4 | 7 | 3 | 2 | 5 | 17 |
| Amen Thompson | 48:23 | 8/14 | 0/0 | 10/13 | 11 | 4 | 3 | 3 | 1 | 26 |
| Josh Okogie | 3:33 | 0/1 | 0/0 | 0/0 | 1 | 0 | 0 | 0 | 0 | 0 |
| Clint Capela | 3:40 | 1/2 | 0/0 | 0/0 | 2 | 1 | 0 | 0 | 0 | 2 |
| Dorian Finney-Smith | 11:00 | 0/5 | 0/4 | 0/0 | 4 | 0 | 1 | 0 | 0 | 0 |
| Aaron Holiday | 5:33 | 0/1 | 0/1 | 0/0 | 0 | 0 | 0 | 0 | 0 | 0 |
| Jae’Sean Tate | 3:23 | 0/0 | 0/0 | 1/2 | 1 | 0 | 0 | 0 | 0 | 1 |
| Jeff Green | 7:31 | 0/2 | 0/1 | 0/0 | 0 | 0 | 0 | 0 | 1 | 0 |
Most Important Statistical Takeaways
1. Shooting efficiency was a major difference
Los Angeles converted 48.1% of its field-goal attempts.
Houston converted 40.8%.
The Lakers therefore gained substantially more value from their shots despite taking fewer attempts.
2. Three-point efficiency strongly favored Los Angeles
The Lakers shot 41.4% from three.
The Rockets shot 28.2%.
That is a 13.2-percentage-point difference.
3. Houston’s leading players produced strong numbers
Sengun and Thompson combined for:
- 59 points
- 27 rebounds
Their performances kept Houston competitive despite the team’s lower shooting percentage.
4. Los Angeles had several creators
James recorded six assists.
Smart had 10.
Kennard added six.
Those three players combined for 22 assists, helping Los Angeles distribute offensive responsibility.
5. Turnovers were not enough to decide the game
Houston committed five fewer turnovers than Los Angeles.
Yet the Rockets still lost.
The Lakers offset the additional turnovers with more efficient shooting and greater free-throw production.
6. Overtime highlighted late-game execution
Los Angeles scored 11 points during overtime.
Houston scored seven.
The additional period reinforced the efficiency and execution differences that had already appeared during regulation.
How to Read the Box Score
A basketball box score becomes more useful when individual statistics are considered together.
For example, Sengun’s 33 points are impressive by themselves. Adding 16 rebounds and six assists provides a much better picture of his overall contribution.
James’ 29 points also become more meaningful when viewed alongside his 13 rebounds, six assists and three steals.
Smart’s 21 points might appear less significant than Sengun’s 33, but his 10 assists, five steals and eight overtime points added several additional dimensions to his performance.
Thompson combined 26 points with 11 rebounds and three blocks.
Smith scored 24 points while making six three-pointers.
Therefore, scoring should be considered alongside shooting efficiency, rebounding, assists, steals, blocks and turnovers.
Why the Four-Point Margin Matters
The final score was 112-108.
That four-point difference shows how closely matched the game was.
A handful of possessions could have changed the result.
A missed three-pointer, a turnover, a defensive rebound or a successful free throw can have an outsized impact when teams are separated by only a few points.
Houston had created enough separation during the fourth quarter to put itself in position to win.
Los Angeles then erased that advantage and forced overtime.
The final score should therefore not be interpreted as evidence that Los Angeles controlled every stage of the contest.
The Lakers led early, Houston mounted a major second-half comeback, and Los Angeles eventually prevailed during the extra period.
Frequently Asked Questions
What was the final score between the Lakers and Rockets?
The Los Angeles Lakers defeated the Houston Rockets 112-108 in overtime on April 24, 2026.
Who led the Lakers in scoring?
LeBron James led Los Angeles with 29 points. He also finished with 13 rebounds, six assists and three steals.
Who led the Rockets in scoring?
Alperen Sengun led Houston with 33 points. He also recorded 16 rebounds, six assists, three steals and one block.
Who had the most rebounds in the game?
Alperen Sengun led all players with 16 rebounds. LeBron James finished next among the highlighted players with 13.
Which team shot better from three-point range?
The Lakers shot 41.4% from three-point range, while the Rockets shot 28.2%.
Why did the Lakers win?
Los Angeles combined stronger overall shooting efficiency with better three-point shooting, seven additional made free throws, more assists and stronger execution during the closing possessions of regulation and overtime.
Conclusion
The Houston Rockets vs Lakers match player stats from April 24, 2026, tell the story of a playoff game decided by efficiency, execution and a few crucial possessions.
Houston had several statistical advantages. The Rockets collected 49 rebounds, committed only 15 turnovers and made 40 field goals. Sengun posted 33 points and 16 rebounds, Thompson added 26 points and 11 rebounds, and Smith connected on six three-pointers.
Despite those performances, Los Angeles found more efficient ways to score.
The Lakers shot 48.1% from the field and 41.4% from three-point range. Houston shot 40.8% overall and 28.2% from beyond the arc.
James led Los Angeles with 29 points and 13 rebounds. Hachimura contributed 22 points on efficient shooting, while Smart produced 21 points, 10 assists and five steals.
The decisive sequence came at the end of regulation. Houston had built a late lead, but Smart’s three made free throws and James’ tying three-pointer helped Los Angeles force overtime.
Smart then scored eight points in the extra period as the Lakers outscored Houston 11-7.
The overall statistical picture shows why raw field-goal totals, rebounds or turnovers cannot be examined in isolation. Houston made more field goals and won the rebounding battle, but Los Angeles produced considerably better shooting efficiency, made more free throws and recorded more assists.
For anyone examining the Houston Rockets vs Lakers match player stats, the key takeaway is the relationship between individual production and team efficiency. Sengun produced the game’s highest scoring total, but the Lakers converted their opportunities more effectively. Houston won the turnover and rebounding categories, yet Los Angeles gained enough advantages in shooting, free throws, playmaking and late-game execution to secure the overtime victory.
That combination made the 112-108 result much closer and more statistically interesting than the final score alone suggests.
About the Author